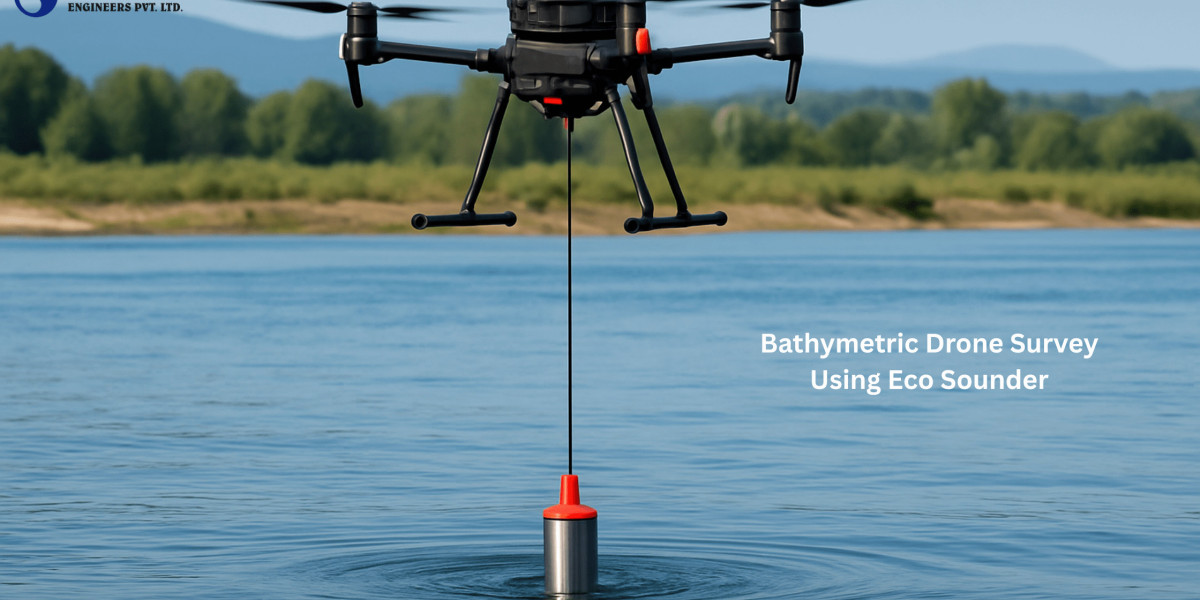
Modern bathymetric survey companies use echo sounding, LiDAR, sonar, and satellite altimetry to collect precise depth information. According to NOAA, more than 70% of Earth’s surface is underwater, yet only about 20% has been mapped in high resolution. Advanced multiband sonar systems can record up to 1,000 soundings per second, creating detailed 3D models of the seafloor. With growing maritime trade and coastal development, demand for high-quality bathymetric data continues to rise.
Hydrographic surveys, both single beam and multi beam systems are essential tools for acquiring accurate underwater data. A single beam system measures water depth along a single line directly beneath the survey vessel, while multi beam technology captures a wider swath, providing high-resolution bathymetric mapping. These measurements are typically obtained using an echo sounder, which transmits sound waves through the water body and calculates depth based on the return time of the signal. In addition to mapping, integrated sensors can monitor water quality, making surveys more comprehensive. Deployments are increasingly carried out via remote control unmanned surface vessels, allowing safe operations in restricted or hazardous areas. In the United States and internationally, these advanced survey techniques support navigation safety, dredging operations, environmental monitoring, and coastal engineering projects.
Methodology of Survey
Bathymetric survey is conducting with defining clear objectives and understanding the scope of the project. Objectives may include improving nautical charts, supporting dredging activities, evaluating underwater habitats, or planning marine infrastructure.
Each goal influences the required data resolution, coverage area, and survey methods. For instance, high-precision harbour mapping may demand multiband sonar and RTK GPS, while general depth profiles for environmental assessments may only need single-beam systems. Determining the scope involves defining the geographical boundaries, expected depth ranges, timeline, and resources available. A reputable bathymetric survey service provider will also consider regulations, safety protocols, and environmental constraints, while engaging key stakeholders such as port authorities, engineers, and environmental agencies to align the survey with legal and operational needs. Clearly defined objectives and a well-scoped project provide the foundation for successful data collection and informed decision-making in marine environments.
Choose the Right Equipment
Selecting the appropriate equipment is critical for a successful bathymetric survey. The choice depends on the objectives, accuracy requirements, waterbody characteristics, and budget. Echo sounders are the primary tools for depth measurement. Single-beam echo sounders (SBES) provide depth directly beneath the vessel and are suitable for small-scale surveys. Multiband echo sounders (MBES), on the other hand, scan a wide swath of the seafloor and deliver high-resolution 3D data, ideal for detailed mapping and larger areas.
Accurate positioning is achieved using GNSS or RTK GPS, often paired with an Inertial Measurement Unit (IMU) to correct for vessel motion. Sound velocity sensors are also essential to adjust for changes in water density and temperature that affect acoustic signals. For shallow or hard-to-reach areas, Unmanned Surface Vehicles (USVs) equipped with sonar and GPS are increasingly popular. Investing in the right combination of hardware and software ensures data quality, efficiency, and the ability to meet specific project goals.
Survey Planning
Effective survey planning is essential to optimize data collection and ensure the safety and efficiency of operations. The first step is designing a line plan—a grid of parallel and perpendicular survey lines—to cover the entire target area uniformly. The spacing of these lines depends on the sonar type, required data resolution, and depth. Tighter line spacing is needed for high-resolution or complex terrain surveys. Planning must also consider tidal conditions, weather forecasts, and navigational hazards. Accurate tidal data or the use of RTK GPS is vital for vertical corrections. Permissions may be required from maritime authorities, especially in busy or restricted waters. The plan should also define vessel speeds, crew roles, daily targets, and emergency procedures. Software tools like Hypack or QINSy can simulate coverage and identify gaps before the field survey begins. Including contingency plans for equipment failure or weather delays can save time and resources. Thorough planning not only maximizes data quality and completeness but also minimizes risks during field operations.
Equipment Setup & Calibration
Proper setup and calibration of survey equipment are fundamental to acquiring accurate bathymetric data. All sensors—including the echo sounder, GNSS receiver, IMU, and sound velocity profiler—must be mounted securely and aligned correctly on the survey vessel. Calibration starts with measuring and inputting offsets between sensors into the survey software to ensure synchronized data. For multibeam systems, a patch test is conducted to calibrate pitch, roll, yaw, and latency offsets. For single-beam systems, a bar check may be performed to verify depth readings. Sound velocity sensors should be deployed at the start and during the survey to profile changes in the water column. Pre-survey testing of all equipment ensures functionality and helps detect any anomalies. Accurate time synchronization across devices is critical for data integrity. Regular maintenance and cleaning of sensors, especially sonar transducers, prevent fouling and data loss. A bathymetric survey organization will document the calibration process as part of quality assurance and future reference.
Conduct the Survey
Executing the survey involves navigating along pre-defined lines while collecting continuous depth and position data. The survey vessel should maintain a constant speed and heading to ensure uniform data density. Operators monitor real-time data for anomalies, coverage gaps, or signal issues using data acquisition software. If using a multiband system, swath overlap between lines should be maintained (typically 20-30%) to ensure complete bottom coverage. The sound velocity profiler may be deployed periodically to account for water column variability. Vessel motion (heave, pitch, and roll) is constantly corrected using the IMU. Safety protocols must be followed, especially in high-traffic or remote waters. Field notes should record environmental conditions, vessel parameters, and any issues encountered. Backup data storage and power supplies help prevent data loss. Effective communication between crew members is key to adjusting plans dynamically if conditions change. Consistent and accurate data collection during this phase is critical for producing usable bathymetric maps and meeting project objectives.
Post-Processing
Post-processing transforms raw sonar and positioning data into accurate bathymetric models. This phase involves applying corrections for tide, sound velocity, vessel motion, and sensor offsets. Software tools such as CARIS, Hypack, and QINSy are used to filter noise, remove outliers, and align data sets. Tidal corrections are applied using tide gauge readings or RTK GPS vertical data. Sound velocity corrections ensure depth accuracy, especially in variable temperature and salinity conditions. Merging overlapping survey lines and cross-checking for consistency is essential for data integrity. Quality control steps include statistical analysis of depth variance, surface smoothing, and comparison against control points. The cleaned and corrected data is then used to create deliverables such as digital terrain models (DTMs), contours, and 3D visualizations. Metadata, including survey dates, sensor specifications, and correction methods, must be documented thoroughly. Bathymetric survey firms conduct quality control through statistical checks and comparisons against benchmarks to ensure reliability before delivering the final outputs.
Reporting & Deliverables
The final step in a bathymetric survey is compiling and delivering the results in a format suitable for end-users. This includes a detailed survey report outlining the methodology, equipment used, calibration procedures, data quality assessments, and any challenges encountered. Deliverables may include digital terrain models (DTMs), contour maps, raw and processed data files, metadata, and 3D visualizations. Charts are typically provided in formats compatible with GIS or CAD software, such as GeoTIFF, DXF, or XYZ. For regulatory or navigation purposes, deliverables must meet accuracy standards set by agencies like the International Hydrographic Organization (IHO). Interactive web maps or online dashboards are increasingly common for data sharing and visualization. Clear documentation of data processing steps and quality control measures ensures transparency and usability. Timely and well-organized by bathymetric survey consultant reporting supports decision-making for infrastructure development, dredging, environmental monitoring, and marine navigation.
Our Projects:
Project: Fixing TBM on the embankment or bank of the lake (Either side Right or Left) at every 200m interval on an existing permanent structure. (Bathymetric survey using single beam single frequency (210 Khz) using Hydro Box HD 210 KHz). Mounting Eco sounder (Hydro box HD 210 KHz Single Beam Single frequency) on survey boat with SP 461 dual frequency GNSS receiver for Positioning.
Scope of Work:
- Total station survey/ Theodolite Survey (Topographical Survey including bathymetry of 2 ponds) to generate 1 meter’s contour interval for 2 existing ponds having catchment area of 0.6 km2.
- Measuring ponds dimensions including the depth also (bathymetry).
- Dead and Live storage capacity of the ponds.
- 8 survey points on depth to water (Depth to water) table around each pond (10 m away and within 50 m radially from the edge of the pond in all 4 directions) along with geotags of Depth to water table points taken (As we have 2 ponds, 4 points each and 8 points in total).
- Identifying the LULC class where the topographic survey points will be conducted.
- Water quality analysis.
Survey Solutions Across India
In civil engineering consultancy field civil engineering company attempt to prepare the detailed project report for lake, river, pond, seashore improvements and proposed structures for that location which may include landscape design, structural design, general arrangement drawings, working drawings, if the bathymetric survey/Hydrographic survey is conducted with the help of advanced instruments, software and methodology as mentioned above, the result to technical service provider companies secure precision results with proper economical cost of the project.
At the time of execution of structures which may be harbor/pumphouse in deep water project management consultancy companies can easily plan to construct the structure with the help of conducted bathymetric survey.
View more article- https://www.sunconengineers.com/soil-investigation-company-in-india/